Cisco-opplæring

Insoft Services er en av få opplæringsleverandører i EMEAR som tilbyr hele spekteret av Cisco-sertifisering og spesialisert teknologiopplæring.

Les mer

Cisco Sertifisering

Opplev en blandet læringstilnærming som kombinerer det beste av instruktørledet opplæring og e-læring i eget tempo for å hjelpe deg med å forberede deg til sertifiseringseksamen.

Les mer

Cisco Learning Credits

Cisco Learning Credits (CLC) er forhåndsbetalte opplæringskuponger innløst direkte med Cisco som gjør planleggingen for suksessen din enklere når du kjøper Cisco-produkter og -tjenester.

Les mer

Etterutdanning

Cisco Continuing Education Program tilbyr alle aktive sertifiseringsinnehavere fleksible alternativer for å resertifisere ved å fullføre en rekke kvalifiserte opplæringselementer.

Les mer

Cisco Digital Learning

Sertifiserte ansatte er verdsatte eiendeler. Utforsk Ciscos offisielle digitale læringsbibliotek for å utdanne deg gjennom innspilte økter.

Les mer

Cisco Business Enablement

Cisco Business Enablement Partner Program fokuserer på å skjerpe forretningsferdighetene til Cisco Channel Partners og kunder.

Les mer

Cisco opplæringskatalog

Les mer

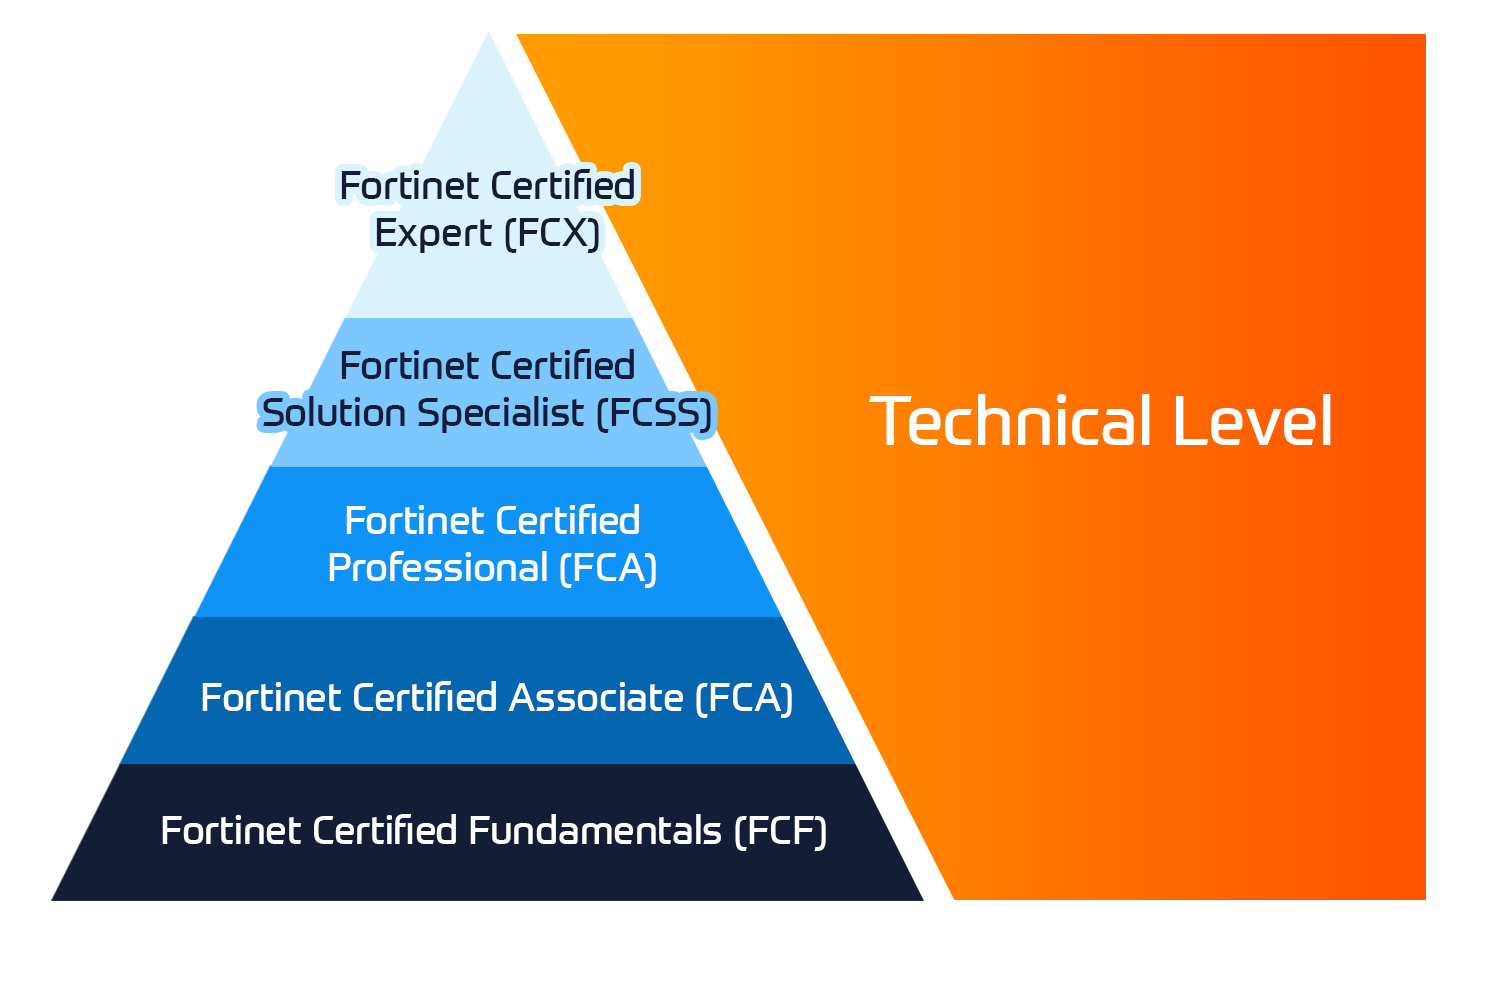
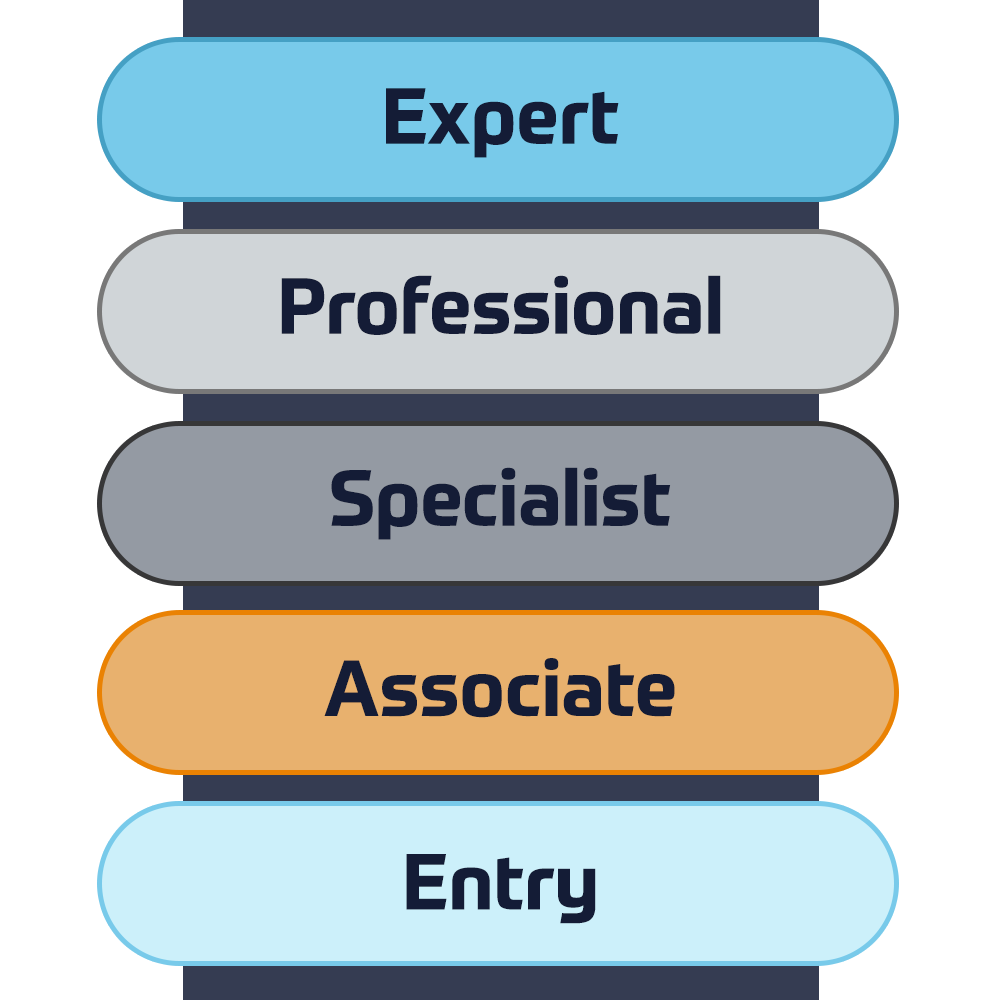
Fortinet Sertifisering

Fortinet Network Security Expert (NSE)-programmet er et opplærings- og sertifiseringsprogram på åtte nivåer for å lære ingeniører om nettverkssikkerheten for Fortinet FW-ferdigheter og -erfaring.

Tekniske kurs

Fortinet-opplæring

Insoft er anerkjent som Fortinet Autorisert Opplæringssenter på utvalgte steder i EMEA.

Les mer

Fortinet opplæringskatalog

Utforsk et bredt utvalg av Fortinet Schedule på tvers av forskjellige land så vel som online kurs.

Les mer

ATC-status

Sjekk atc-statusen vår på tvers av utvalgte land i Europa.

Les mer

Pakker for Fortinet-tjenester

Insoft Services har utviklet en spesifikk løsning for å effektivisere og forenkle prosessen med å installere eller migrere til Fortinet-produkter.

Les mer

Microsoft-opplæring

Insoft Services gir Microsoft opplæring i EMEAR. Vi tilbyr Microsofts tekniske opplærings- og sertifiseringskurs som ledes av instruktører i verdensklasse.

Tekniske kurs

Extreme-opplæring

Lær eksepsjonell kunnskap og ferdigheter i ekstreme nettverk.

Les mer

Teknisk sertifisering

Vi tilbyr omfattende læreplan over tekniske kompetanseferdigheter om sertifiseringsprestasjonen.

Les mer

Extreme opplæringskatalog

Tekniske kurs

ATP-akkreditering

Som autorisert opplæringspartner (ATP) sørger Insoft Services for at du får de høyeste utdanningsstandardene som er tilgjengelige.

Les mer

Løsninger og tjenester

Vi tilbyr innovativ og avansert støtte for design, implementering og optimalisering av IT-løsninger. Vår kundebase inkluderer noen av de største Telcos globalt.

Les mer

Globalt anerkjent team av sertifiserte eksperter hjelper deg med å gjøre en jevnere overgang med våre forhåndsdefinerte konsulent-, installasjons- og migrasjonspakker for et bredt spekter av Fortinet-produkter.

Om oss

Insoft Tilbyr autoriserte opplærings- og konsulenttjenester for utvalgte IP-leverandører. Finn ut hvordan vi revolusjonerer bransjen.

Les mer
  • +47 23 96 21 03
  • Authoring Visual Analytics Using Amazon QuickSight

    Duration
    2 Dager
    Delivery
    (Online Og På stedet)
    Price
    Pris på forespørsel

    In this course, you will build a data visualization solution using Amazon QuickSight. QuickSight allows everyone in your organization to understand your data by exploring through interactive dashboards, asking questions in natural language, or automatically looking for patterns and outliers powered by machine learning. This course focuses on connecting to data sources, building visuals, designing interactivity, and creating calculations. You will learn how to apply security best practices to your analyses. You will also explore the machine learning capabilities built into QuickSight.


    • Course level: Advanced

    In this course, you will learn to:

    • Explain the benefits, use cases, and key features of Amazon QuickSight
    • Design, create, and customize QuickSight dashboards to visualize data and extract business insights from it
    • Select and configure appropriate visualization types to identify, explore, and drill down on business insights
    • Describe how to use one-click embed to incorporate analytics into applications
    • Connect, transform, and prepare data for dashboarding consumption
    • Perform advanced data calculations on QuickSight analyses
    • Describe the security mechanisms available for Amazon QuickSight
    • Apply fine-grained access control to a dataset
    • Implement machine learning on data sets for anomaly detection and forecasting
    • Explain the benefits and key features of QuickSight Q to enhance the dashboard user experience

    Day 1


    Module 1: Introduction and Overview of Amazon QuickSight

    • Introducing Amazon QuickSight
    • Why use Amazon QuickSight for data visualization

    Module 2: Getting Started with Amazon QuickSight

    • Interacting with Amazon QuickSight
    • Loading data into Amazon QuickSight
    • Visualizing data in Amazon QuickSight
    • Demonstration: Walkthrough of Amazon QuickSight interface
    • Practice Lab: Create your first dashboard

    Module 3: Enhancing and Adding Interactivity to Your Dashboard

    • Enhancing your dashboard
    • Demonstration: Optimize the size, layout, and aesthetics of a dashboard
    • Enhancing visualizations with interactivity
    • Demonstration: Walkthrough of dashboard interactivity features
    • Practice Lab: Enhancing your dashboard

    Module 4: Preparing Datasets for Analysis

    • Working with datasets
    • Demonstration: Transform your datasets for analysis
    • Practice Lab: Preparing data for analysis

    Module 5: Performing Advanced Data Calculations

    • Transform data using advanced calculations
    • Practice Lab: Performing advanced data calculations

    Activity: Designing a Visual Analytics Solution


    Day 2


    Module 6: Overview of Amazon QuickSight Security and Access Control

    • Overview of Amazon QuickSight security and access control
    • Dataset access control in Amazon QuickSight
    • Lab: Implementing access control in Amazon QuickSight visualizations

    Module 7: Exploring machine learning capabilities

    • Introducing Machine Learning (ML) insights
    • Natural Language Query with QuickSight Q
    • Demonstration: Using QuickSight Q
    • Lab: Using machine learning for anomaly detection and forecasting

    End of day challenge labs

    • Join data sources together
    • Create a dashboard
    • Enhance the dashboard and add interactivity
    • Perform advanced data calculations
    • Integrate machine learning tools into the dashboard

    This course is intended for:

    • Data and business analysts who build and manage business analytics dashboards

    Students with a minimum one-year experience authoring visual analytics will benefit from this course.


    We recommend that attendees of this course have:

    • Completed Data Analytics Fundamentals
      Datoer
      Date on Request

    Follow Up Courses

    Filtrer
    • 3 Dager
      Date on Request
      Price on Request
      Book Now
    • 3 Dager
      Date on Request
      Price on Request
      Book Now
    • 3 Dager
      Date on Request
      Price on Request
      Book Now
    • 3 Dager
      Date on Request
      Price on Request
      Book Now
    • 3 Dager
      Date on Request
      Price on Request
      Book Now
    • 1 Dag
      Date on Request
      Price on Request
      Book Now
    • 3 Dager
      Date on Request
      Price on Request
      Book Now
    • 1 Dag
      Date on Request
      Price on Request
      Book Now
    • 1 Dag
      Date on Request
      Price on Request
      Book Now
    • 3 Dager
      Date on Request
      Price on Request
      Book Now

    Know someone who´d be interested in this course?
    Let them know...

    Use the hashtag #InsoftLearning to talk about this course and find students like you on social media.