Cisco-Ausbildung

Insoft Services ist einer der wenigen Schulungsanbieter in EMEAR, der ein umfassendes Angebot an Cisco-Zertifizierungen und spezialisierten Technologieschulungen anbietet.

Lesen Sie mehr

Cisco Zertifizierungen

Erleben Sie einen Blended-Learning-Ansatz, der das Beste aus von Lehrern geleiteten Schulungen und E-Learning zum Selbststudium kombiniert, um sich auf Ihre Zertifizierungsprüfung vorzubereiten.

Lesen Sie mehr

Cisco Learning Credits

Cisco Learning Credits (CLCs) sind Prepaid-Schulungsgutscheine, die direkt bei Cisco eingelöst werden und die Planung für Ihren Erfolg beim Kauf von Cisco-Produkten und -Services erleichtern.

Lösen Sie Ihre CLCs ein

Cisco Continuing Education

Das Cisco Continuing Education Program bietet allen aktiven Zertifizierungsinhabern flexible Optionen zur Rezertifizierung, indem sie eine Vielzahl von in Frage kommenden Schulungselementen absolvieren.

Lesen Sie mehr

Cisco Digital Learning

Zertifizierte Mitarbeiter sind GESCHÄTZTE Vermögenswerte. Erkunden Sie die offizielle Digital Learning Library von Cisco, um sich durch aufgezeichnete Sitzungen weiterzubilden.

CDLL-Katalog

Cisco Business Enablement

Das Cisco Business Enablement Partner Program konzentriert sich auf die Verbesserung der Geschäftsfähigkeiten von Cisco Channel Partnern und Kunden.

Lesen Sie mehr

Cisco Schulungskatalog

Lesen Sie mehr

Technische Zertifizierung

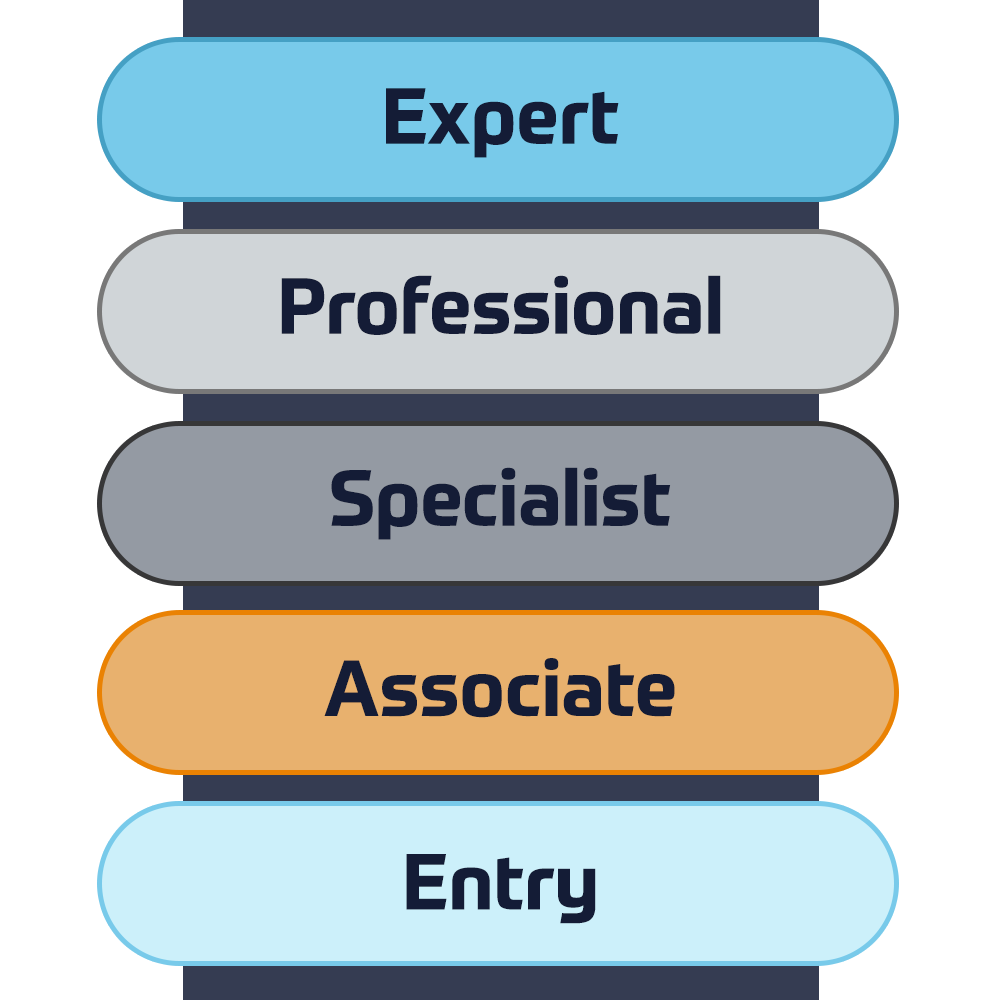
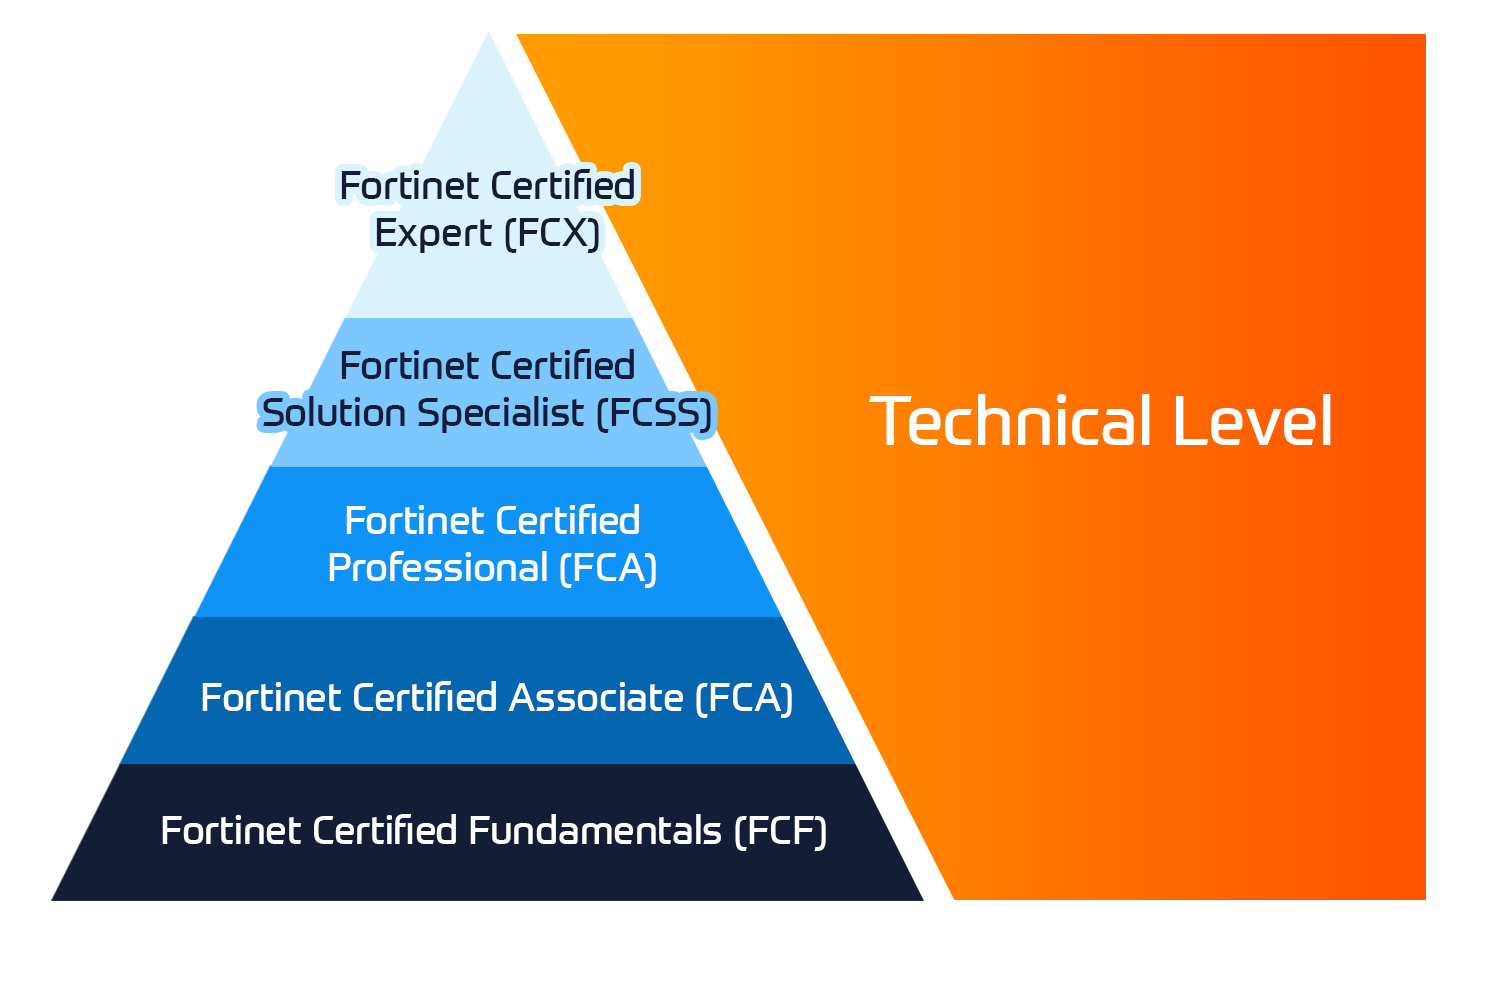
Das Fortinet Network Security Expert (NSE) -Programm ist ein achtstufiges Schulungs- und Zertifizierungsprogramm, um Ingenieuren ihre Netzwerksicherheit für Fortinet FW-Fähigkeiten und -Erfahrungen beizubringen.

Technische Kurse

Fortinet-Ausbildung

Insoft ist als Fortinet Authorized Training Center an ausgewählten Standorten in EMEA anerkannt.

Lesen Sie mehr

Fortinet Schulungskatalog

Lesen Sie mehr

ATC Status

Überprüfen Sie unseren ATC-Status in ausgewählten Ländern in Europa.

Lesen Sie mehr

Fortinet Service-Pakete

Insoft Services hat eine spezielle Lösung entwickelt, um den Prozess der Installation oder Migration zu Fortinet-Produkten zu rationalisieren und zu vereinfachen.

Lesen Sie mehr

Microsoft-Ausbildung

Insoft Services bietet Microsoft-Schulungen in EMEAR an. Wir bieten technische Schulungen und Zertifizierungskurse von Microsoft an, die von erstklassigen Instruktoren geleitet werden.

Technische Kurse

Extreme-Ausbildung

Erfahren Sie außergewöhnliche Kenntnisse und Fähigkeiten von Extreme Networks.

Technische Kurse

Technische Zertifizierung

Wir bieten einen umfassenden Lehrplan für technische Kompetenzen zur Zertifizierung an.

Lesen Sie mehr

Extreme Schulungskatalog

Hier finden Sie alle Extreme Networks online und den von Lehrern geleiteten Kalender für den Klassenraum.

Lesen Sie mehr

ATP-Akkreditierung

Als autorisierter Schulungspartner (ATP) stellt Insoft Services sicher, dass Sie die höchsten verfügbaren Bildungsstandards erhalten.

Lesen Sie mehr

Lösungen & Dienstleistungen

Wir bieten innovative und fortschrittliche Unterstützung bei der Konzeption, Implementierung und Optimierung von IT-Lösungen. Unsere Kundenbasis umfasst einige der größten Telcos weltweit.

Beratungspakete

Ein weltweit anerkanntes Team von zertifizierten Experten unterstützt Sie bei einem reibungsloseren Übergang mit unseren vordefinierten Beratungs-, Installations- und Migrationspaketen für eine breite Palette von Fortinet-Produkten.

Über uns

Insoft bietet autorisierte Schulungs- und Beratungsdienstleistungen für ausgewählte IP-Anbieter. Erfahren Sie, wie wir die Branche revolutionieren.

Lesen Sie mehr
  • +49 6151 277 6496
  • Data Visualization with Python

    Duration
    3 Tage
    Delivery
    (Online Und Vor Ort)
    Price
    Preis auf Anfrage
    With so much data being continuously generated, developers with a knowledge of data analytics and data visualization are always in demand. With Data Visualization with Python, you'll learn how to use Python with NumPy, Pandas, Matplotlib, and Seaborn to create impactful data visualizations with real-world, public data. This Data Visualization with Python course takes a hands-on approach to the practical aspects of using Python to create effective data visuals. It contains multiple activities that use real-life business scenarios for you to practice and apply your new skills in a highly relevant context.  

    Lesson One: Importance of data visualization and data exploration

    • Topic 1: Introduction to data visualization and its importance
    • Topic 2: Overview of statistics
      • Activity 1: Compute mean, median, and variance for the following numbers and explain the difference between mean and median
    • Topic 3: A quick way to get a good feeling for your data
    • Topic 4: NumPy
      • Activity 1: Use NumPy to solve the previous activity
      • Activity 2: Indexing, slicing, and iterating
      • Activity 3: Filtering, sorting, and grouping
    •  Topic 5: Pandas
      • Activity 1: Repeat the NumPy activities using pandas, what are the advantages and disadvantages of pandas?


    Lesson Two: All you need to know about plots

    • Topic 1: Choosing the best visualization
    • Topic 2: Comparison plots
      • Line chart
      • Bar chart
      • Radar chart
      • Activity 1: Discussion round about comparison plots
    •  Topic 3: Relation plots
      • Scatter plot
      • Bubble plot
      • Heatmap
      • Correlogram
      • Activity 1: Discussion round about relation plots
    •  Topic 4: Composition plots
      • Pie chart
      • Stacked bar chart
      • Stacked area chart
      • Venn diagram
      • Activity 1: Discussion round about composition plots
    •  Topic 5: Distribution plots
      • Histogram
      • Density plot
      • Box plot
      • Violin plot
      • Activity 1: Discussion round about distribution plots
    •  Topic 6: Geo plots
    • Topic 7: What makes a good plot?
      • Activity 1: Given a small dataset and a plot, reason about the choice of visualization and presentation and how to improve it


    Lesson 3: Introduction to NumPy, Pandas, and Matplotlib

    • Topic 1: Overview and differences of libraries
    • Topic 2: Matplotlib
    • Topic 3: Seaborn
    • Topic 4: Geo plots with geoplotlib
    • Topic 5: Interactive plots with bokeh


    Lesson 4: Deep Dive into Data Wrangling with Python

    • Topic 1: Matplotlib
    • Topic 2: Pyplot basics
    • Topic 3: Basic plots
      • Activity 1: Comparison plots: Line, bar, and radar chart
      • Activity 2: Distribution plots: Histogram, density, and box plot
      • Activity 3: Relation plots: Scatter and bubble plot
      • Activity 4: Composition plots: Pie chart, stacked bar chart, stacked area chart, and Venn diagram
    • Topic 4: Legends
      • Activity 1: Adding a legend to your plot
    • Topic 5: Layouts
      • Activity 1: Displaying multiple plots in one figure
    • Topic 6: Images
      • Activity 1: Displaying a single and multiple images
    • Topic 7: Writing mathematical expressions


    Lesson 5: Simplification through Seaborn

    • Topic 1: From Matplotlib to Seaborn
    • Topic 2: Controlling figure aesthetics
      • Activity 1: Line plots with custom aesthetics
      • Activity 2: Violin plots
    • Topic 3: Color palettes
      • Activity 1: Heatmaps with custom colour palettes
    • Topic 4: Multi-plot grids
      • Activity 1: Scatter multi-plot
      • Activity 2: Correlogram


    Lesson 6: Plotting geospatial data

    • Topic 1: Geoplotlib basics
      • Activity: Plotting geospatial data on a map
      • Activity: Choropleth plot
    • Topic 2: Tiles providers
    • Topic 3: Custom layers
      • Activity: Working with custom layers


    Lesson 7: Making things interactive with Bokeh

    • Topic 1: Bokeh basics
    • Topic 2: Adding Widgets
      • Activity 1: Extending plots with widgets
    • Topic 3: Animated Plots
      • Activity 1: Animating information


    Lesson 8: Combining what we’ve learned

    • Topic 1: Recap
    • Topic 2: Free exercise
      • Activity 1: Given a new dataset, the students have to decide in small groups which data they want to visualize and which plot is best for the task.
      • Activity 2: Each group gives a quick presentation about their visualizations.


    Lesson 9: Application in real life and Conclusion of course

    • Applying Your Knowledge to a Real-life Data Wrangling Task
    • An Extension to Data Wrangling

    Data Visualization with Python is designed for developers and scientists, who want to get into data science or want to use data visualizations to enrich their personal and professional projects.

    You do not need any prior experience in data analytics and visualization, however, it’ll help you to have some knowledge of Python and familiarity with high school level mathematics. Even though this is a beginner level course on data visualization, experienced developers will be able to improve their Python skills by working with real-world data.

    Hardware:

    For the optimal student experience, we recommend the following hardware configuration:

    • OS: Windows 7 SP1 32/64-bit, Windows 8.1 32/64-bit or Windows 10 32/64- bit, Ubuntu 14.04 or later, or macOS Sierra or later
    • Processor: Dual Core or better
    • Memory: 4GB RAM
    • Storage: 10 GB available space software
    • Browser: Google Chrome or Mozilla Firefox
    • Conda
    • JupyterLab and Jupyter Notebook
    • Sublime Text (latest version), Atom IDE (latest version), or other similar text editor applications
    • Python 3
    • The following Python libraries installed: NumPy, pandas, Matplotlib, seaborn, geoplotlib, Bokeh, and squarify


    Installation and Setup

    • Before you start this course, we’ll install Python 3.6, pip, and the other libraries used throughout this course. You will find the steps to install them here.


    Installing Python


    Installing pip

    You might need to use the python3 get-pip.py command, due to previous versions of Python on your computer that already use the python command.


    Installing libraries

    Using the pip command, install the following libraries:

    • python -m pip install -user numpy matplotlib jupyterlab pandas squarify
    • bokeh geoplotlib seaborn


    Working with JupyterLab and Jupyter Notebook

    You can either download it using GitHub or as a zipped folder by clicking on the green Clone or download button on the upper-right side.

    In order to open Jupyter Notebooks, you have to traverse into the directory with your terminal. To do that, type:

    • cd Data-Visualization-with-Python/<your current lesson>

    For example cd Data-Visualization-with-Python/lesson01/

    To complete the process, perform the following steps:

    1. To reach each activity and exercise, you have to use cd once more to go into each folder, like so: cd Activity01
    2. Once you are in the folder of your choice, simply call jupyter-lab to start up JupyterLab. Similarly, for Jupyter Notebook, call jupyter notebook.


    Importing Python Libraries

    • Every exercise and activity in this course will make use of various libraries.


    Importing libraries into Python is very simple and here’s how we do it:

    1. To import libraries, such as NumPy and pandas, we have to run the following code. This will import the whole numpy library into our current file: import numpy # import numpy
    2. In the first cells of the exercises and activities of this courseware, you will see the following code. We can use np instead ofnumpy in our code to call methods from numpy: import numpy as np # import numpy and assign alias np
    3. In later lessons, partial imports will be present, as shown in the following code. This only loads the mean method from the library: from numpy import mean # only import the mean method of numpy
      Termine
      Datum auf Anfrage

    Follow Up Courses

    Filter
    • 2 Tage
      Datum auf Anfrage
      Price on Request
      Book Now
    • 3 Tage
      Datum auf Anfrage
      Price on Request
      Book Now
    • 3 Tage
      Datum auf Anfrage
      Price on Request
      Book Now
    • 3 Tage
      Datum auf Anfrage
      Price on Request
      Book Now
    • 2 Tage
      Datum auf Anfrage
      Price on Request
      Book Now
    • 4 Tage
      Datum auf Anfrage
      Price on Request
      Book Now
    • 2 Tage
      Datum auf Anfrage
      Price on Request
      Book Now
    • 3 Tage
      Datum auf Anfrage
      Price on Request
      Book Now

    Know someone who´d be interested in this course?
    Let them know...

    Use the hashtag #InsoftLearning to talk about this course and find students like you on social media.